

A clinical operations dashboard flags a resource bottleneck. A portfolio report shows competing programs drawing on the same specialists. A commercial forecast reveals a widening gap between expected and actual performance.

The information is visible. The next step is less clear.
Who should act? Which priorities should change? What approvals are needed? How will teams know whether the response worked?
For life sciences organizations, this decision-to-execution gap can limit the value of analytics. Better visibility helps teams recognize problems, but business results depend on what happens after the dashboard is reviewed.
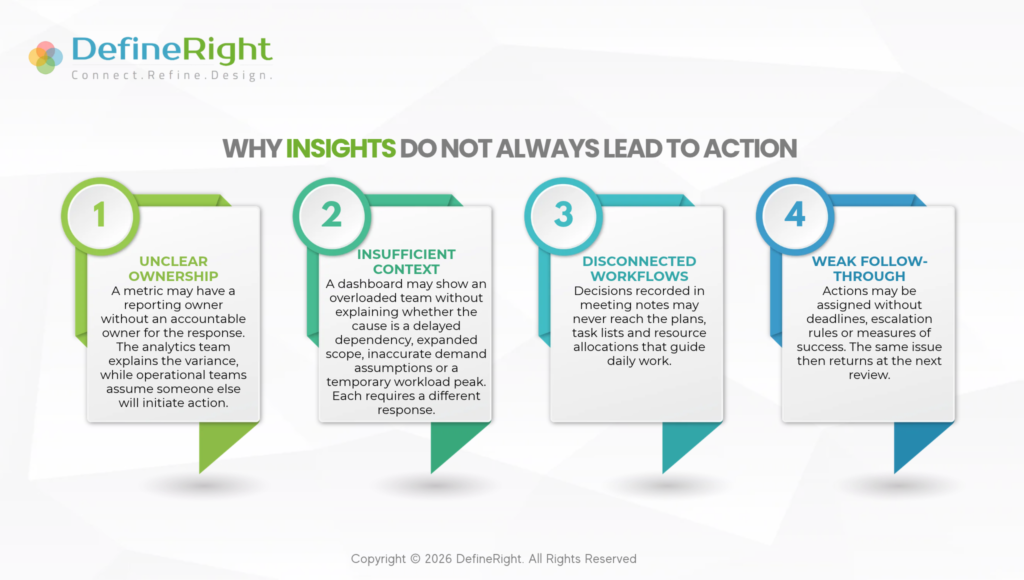
Why Insights Do Not Always Lead to Action
Life sciences decisions often span functions with different responsibilities, planning cycles and constraints. A change in a clinical milestone may affect resource demand, vendor commitments, financial forecasts and downstream activities. Acting on that change requires coordination beyond the team that first identifies it.
Closing these gaps requires connecting analytics with the way the organization makes and implements decisions.
Start with the Decision the Dashboard Must Support
Dashboard design should begin with a practical question: What decision should this information help someone make?
For a development operations team, that decision might be whether to reallocate capacity, adjust sequencing or seek additional support. For finance, it might involve revising a forecast after a milestone change. For a commercial team, it could mean investigating a performance variance before adjusting deployment.
Defining the decision clarifies what the dashboard needs to show:
- The threshold that warrants attention.
- The information needed to understand the issue.
- The person authorized to decide.
- The available responses and their constraints.
A utilization figure becomes more useful when it is connected to upcoming milestones, required skills and the consequences of leaving the situation unresolved.
Build a Repeatable Path from Signal to Execution
A practical operating model connects five steps.
1. Validate the signal
Before acting, confirm that the finding reflects a business issue. Check data freshness, definitions, mappings and planning assumptions.
An apparent capacity shortage, for example, may reflect an outdated project timeline rather than a genuine increase in demand. Validation prevents teams from reorganizing work around misleading information.
2. Assess the implications
Translate the finding into operational consequences. Which milestones, teams, costs or dependencies could be affected? What happens if the organization takes no action?
This step also reveals trade-offs. Moving a specialist to resolve one bottleneck may create another elsewhere. Teams need a view of the wider impact before selecting a response.
3. Make and record the decision
Assign a decision owner and document the chosen response, rationale and assumptions. Where approvals are required, make those requirements explicit.
The record should distinguish between an option under discussion and an approved action. This helps teams work from the same understanding as plans evolve.
4. Embed the response in working plans
Convert the decision into specific tasks, owners, deadlines and dependencies. Update the relevant resource plans, forecasts and operational workflows.
In regulated activities, implementation must follow applicable quality, documentation and change-control requirements. A dashboard alert should initiate the appropriate review process.
5. Review the outcome
Track whether the action was completed and whether it addressed the original issue.
These are separate questions. A resource reassignment may be complete while the milestone remains at risk because a vendor dependency is unresolved. Reviewing both execution and outcomes helps teams identify the next necessary intervention.
Make Decision Reviews Actionable
Consider an illustrative clinical planning scenario. A dashboard shows that two studies will require the same data management specialists during an overlapping period.
An effective review would confirm the demand assumptions, assess milestone flexibility, compare internal and external capacity options, and approve a response. Named owners would then update assignments and timelines. Subsequent reviews would check whether the intervention reduced the conflict.
The dashboard remains essential throughout this process. It identifies the issue and helps evaluate the response. Its value grows when it connects to accountable action.
Measure the Effectiveness of the Response
Organizations can assess this connection through measures such as:
- Time from a validated signal to an approved decision.
- Percentage of approved actions completed by their due dates.
- Frequency of recurring issues after corrective action.
- Changes in the milestone, capacity, cost or performance measure that prompted the response.
These measures help distinguish reporting activity from operational improvement.
Connecting Insight with Execution
At DefineRight, we help life sciences organizations connect data and decision intelligence with operational execution through business analysis, process design and tailored digital solutions.
The objective is to establish a clear path from identifying an issue to understanding its implications, assigning accountability and tracking the result.
A useful dashboard shows where attention is needed. A connected decision and execution process ensures that attention leads to action.